Overview
To support a client conducting large-scale hydrographical survey operations, JAK Services designed and developed a component-based automated onboard hydrographic data-processing pipeline. Its purpose was to automatically and continuously generate a preliminary dataset closely approximating the final processed data, enabling rapid detection of areas requiring re-survey before the vessel had moved too far from the site.
Workflow integration
The pipeline was fully orchestrable and integrated seamlessly with—while complementing—existing workflows, such as EIVA’s Workflow Manager (WFM) for Multi Beam Echo Sounder (MBES) data. The orchestration application was designed to be payload-agnostic and could also be used with Side-Scan Sonar (SSS) and other sensor types.
Real-time data ingestion and preprocessing
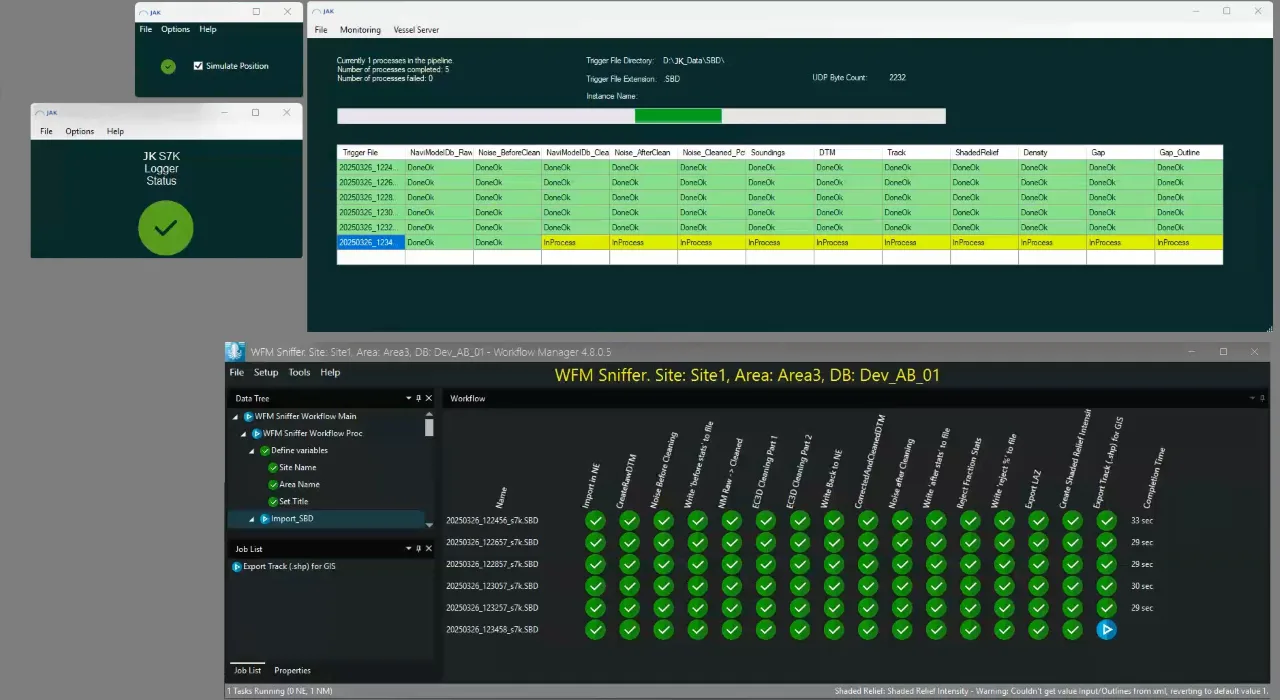
The pipeline illustrated in the image above featured:
- Real-time payload streaming with automated file rotation at defined intervals and end-of-line, saving to EIVA’s .SBD format. For MBES data, this component was only used when EIVA NaviScan was not used for logging.
- Automated processing of ancillary data such as SVP and navigation (for navigation generated via post-processing APIs, the system continuously produced navigation files with run-in/out extensions for each new SBD).
Automated sorting and WFM integration
Once generated—and after any corresponding ancillary data was processed—the SBD files were continuously sorted according to active site and area names, then automatically imported and organized into EIVA WorkFlow Manager (WFM) for linking with ancillary data, cleaning, and exporting as point-cloud files.
Automated QC and analysis outputs
These point-cloud files were then processed by the JAK Services–developed orchestration application, which executed command-line tools to:
- Perform gridding
- Generate QC products such as density maps, gap polygons, and sizing metrics
- Produce go/no-go traffic-light matrices aligned with WFM conventions
GIS deliverables and visualization
The orchestration application then generated low-volume GIS deliverables—including DTM, grayscale and color shaded reliefs, track plots, slope maps, red/green density charts, coverage layers, gap polygons, and more—ready for transfer to a web portal for visualization and download.
Final deliverables
Finally, the same applications were used to export the final merged deliverables once the data had been quality-checked by an operator.